This article’s subject is website performance problems and web-site hosting server problems. It is meant as the first in a series of several articles.
1. Introduction – problems with my website
This spring (2018), probably due to a relatively sudden rise in the number of visitors, bikegremlin.com website has experienced some problems:
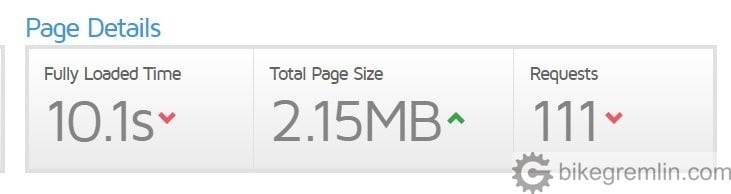
- Very slow page loading – over 10 seconds per page.
- Appearance of “500 Internal Server Error” messages when trying to open (view) a page, or save changes when editing one.
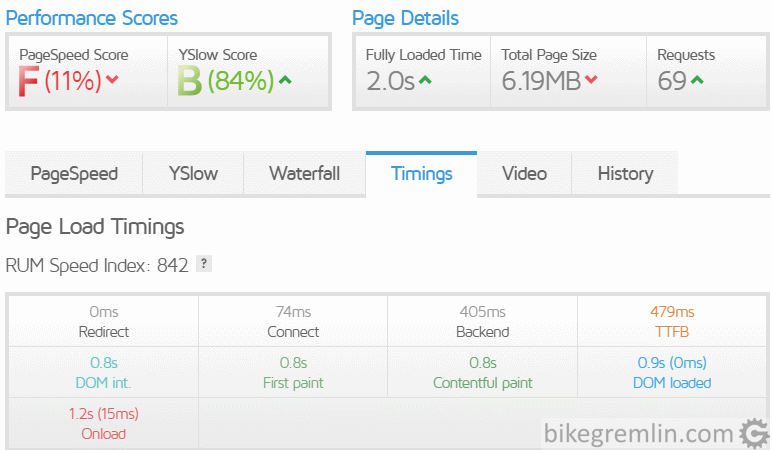
Pictures 1 and 2 show the site response time and the 500 error, while details of what they represent will be explained later.
Picture 1
This was worrying, so I got to finding out the cause, in order to solve the problem(s).
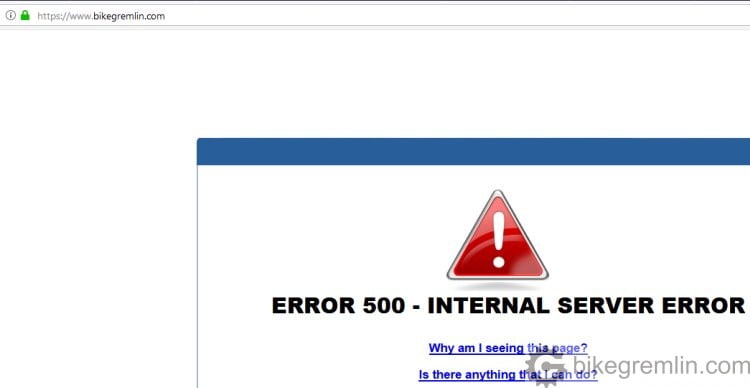
A message that must “delight” any website visitor, or administrator.
Picture 2
2. Potential problem causes
Simply and generally put, each “viewing” of a website starts from a computer/smartphone, goes over the Internet to a server where the website is hosted (“stored”), then the server send the requested page/information back to the computer. This means that a slow, or non-working website can be caused by problems with any of the three mentioned “participants“, or with several of them at the same time.
2.1. Computer/smartphone/tablet etc. based problems
Device used for viewing a website can have problems: viruses, poor hardware, badly set up browser etc. A simple way to test this is to open several different websites, from several different Internet connection points. If they all work slowly, or don’t work at all, while working fine on other devices, there probably is some problem with the tested device.
2.2. Internet problems
Slow Internet – best tested by using several different devices, opening various different websites and using speedtest.net Internet connection speed testing website. If a device works fine with other connections, even more if test with other devices confirms the results, there is most probably a problem with the particular tested Internet connection speed/quality.
2.3. Server (website) problems
If a website is responding slowly, taking long to open a page, or not working at all (“500 Internal Server Error” for example) – while other websites tested from the same device(s) using the same Internet connection(s) are working just fine, there is most probably a problem with the website and/or its hosting server.
3. Determining the cause of the problem(s)
In the 2nd chapter I’ve practically already explained the method for determining a problem cause. Using method of elimination, I’ve tested one by one “participant” in order to find the “culprit”. Using several different computers, smartphones, from several different Internet connection locations, all clearly pointed to a problem with the server, or website itself.
3.1. Measurement
One good measurement is worth more than a thousand expert opinions – in my expert opinion. 🙂
After determining there’s a problem on the server side, best way of finding out what exactly causes problems (whether it is only one, or more things) is to take some “measurements”. There are many on-line programs for testing web page/site response speed, uptime (how long is a site not off-line), behaviour when opening pages (more on this later) etc. I’ll list programs that have helped me do this. Most are free for some basic functions (testing one website) and most charge some money for “serious” professional use (monitoring several websites, recording statistics, using advanced tools etc.).
For a full disclosure: clicking on the links below, if you buy a product/service, I’ll get a few dollars, while the price for you will be the same, whichever route you go to those sites. The reason for listing these programs is because I find them good and they worked for me. You can take my word for it, or not – spending time and doing your own research. If you opt for the latter, I’m eager to hear your feedback, especially if you find some better tools/services, so it can be shared on the website in order to help the others – share the knowledge and good vibes, it pays back tenfold. 🙂
3.2. Tools used for measurement
Uptime measuring tools:
- HetrixTools – my choice, for easy to navigate menus, included “black-list” reports and an option of sharing the reports on-line.
- UptimeRobot – does what it says, quite good. Uptime reports.
Both programs can be set to send an e-mail once the monitored website is off-line, as well as when it gets back on-line.
Speed and behaviour measurement tools:
Googling “page/site speed test” gives lots of results. Among the usual top 10 are the ones I too found as the most useful.
- GTmetrix – gives a detailed overview of a site/page load speed, behaviour, optimisation and gives tips for improvement in a detailed report. Allows choosing test server location, Internet connection speed and browser used for testing.
- Google PageSpeed Insights – Google’s tool that gives a “rough image” of how the site looks and how fast it works on a computer and on a smart-phone. With a few optimization suggestions. However, it gives no behaviour, or timing, so is not good for “troubleshooting”. By writing “origin:” before entering web address that’s to be tested, it will give an overview of average page performance with Chrome browser visitors.
- Dotcom-Tools Website Speed Test – tests from 24 different locations world-wide “at once”. With a list of page load timings of first, and “repeated visit” for each location. Handy.
- Webpagetest – apart from choosing test location, it also enables choosing the testing device (several different smartphone models), web-browser and Internet connection speed of the testing device.
Google webmaster tools:
These tools require that you “verify” ownership of the site (providing several methods, simplest being upload of a file they provide and then checking whether it is “in place”).
- GoogleAnalytics – set of very useful stats for monitoring website’s behaviour and performance. Far more than just average page load time. This tool takes some time to get used to and master. It is not necessary for the topic of this article, but it is worth mentioning and recommending.
- Google Webmaster Tools – tool more important for search (and website Google ranking), but it too gives info whether Google has problems navigating the site, or opening some links/pages.
3.3. Testing/measurement methods
Now I’ll explain what it is that I measured and what does “behaviour” of a page/website when contacted mean. This is what a page load time report looks like:
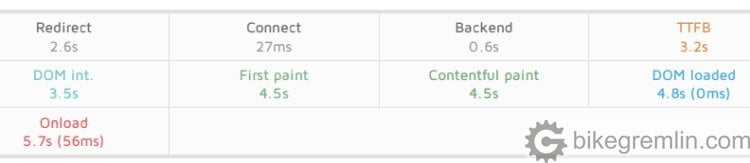
Picture 3
Picture 3 shows orange value TTFB (Time To First Byte) – that is the time passed from visitor’s typing address/clicking on a link, until the server starts sending first data to the website visitor (the whole page is not yet loaded). Desirable time for loading the whole page is around 3 seconds, while here it took that long just to get the first byte.
TTFB is the sum of the following times:
- Redirect: my website uses SSL/TLS encryption (https protocol) and www.bikegremlin.com address. If a visitor types “bikegremlin.com”, it would take three redirects before they reach the website (http://bikegremlin.com -> https://bikegremlin.com -> https://www.bikegremlin.com). If this time is too slow, it means that redirections need to be sorted out, on server and DNS, so that visitors can quickly be “sent” to the right address. How to shorten this will be explained in a separate article.
- Connect: time it takes until the server returns “200 OK” value, noting that it has accepted visitor’s request (for showing a web-page, or data). If this time takes too long (over 150 ms), it means that the server has poor connection to the Internet, or is overloaded (one does not rule out the other).
- Backend: once connection has been established, this is the time server takes to generate a response. Anything over 500 ms is considered too slow and means that either the server is slow, or the website is not properly optimised, or that visitor’s Internet connection to the server is too slow (again, one does not rule out the others).
During all this time, visitor’s browser shows nothing – a blank, white page. Measurement should be repeated from various locations and with various website pages, to get a broader performance picture.
After TTFB starts the sending of page. Depending on the number, size and types of “objects” on the page, bottlenecks can be:
- Number of connections per browser – if the maximum number of connections a browser can receive is exceeded, user’s browser must wait until some objects are completely rendered before downloading new ones.
- Server speed and website optimisation – if they are not good, it will take long time before all the data is sent to the visitor.
- Size of objects that need to be downloaded (large, not optimised pictures for example).
- Number and optimisation of scripts that visitor’s browser needs to process in order to show the page correctly.
These bottlenecks can be noted by looking at “waterfall” chart made by a page speed testing program. Here is what GTmetrix’s waterfall chart looks like:
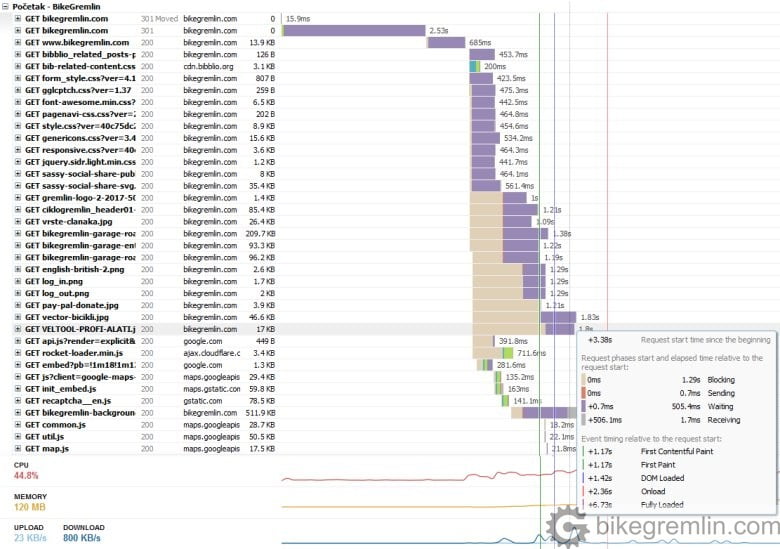
Picture 4
Picture 4 shows many creme and purple lines, that is where most of the time is “wasted”. In GTmetrix purple lines show the time spent waiting for the server to generate response and start sending data, while creme lines show visitor’s browser idle time, because the browser has too many open connections and can’t accept any more objects for downloading.
This points to the following potential problems:
- Too many objects and poorly optimised scripts, putting too much load on the server and asking for too many open connections.
- Slow server, not able to handle all the tasks fast enough.
One does not exclude the other. It can also be noted that there are a lot of rows. This means a lot of separate objects to be loaded. Not good.
Separate articles in this section explain what I did in order to improve the results and narrow down the causes of the website slowing down:
- Website optimization [01] Measuring “performance”
- Website optimization [02] DNS and redirects
- Website optimization [03] Caching and compressing
- Website optimization [04] WordPress plugins – speed and stability
- Website optimization [05] Images – pictures
- Website optimization [06] SEO
- Website optimization [07] Permalink change
- Caching a WordPress website
- Hosting server location impact on website speed
– Relja Surveyor Novović
4. Sources
- GTmetrix – How to Read a Waterfall Chart for Beginners.
- Webdesignerdepot – Reading Waterfall Charts to Focus on Page Speed
- Vanseo Design – Performance Testing – Tools And Waterfall Diagrams
Affiliate link:

Last updated:
Originally published: