A case study of how a hosting server’s physical (geographical) location affects website speed, i.e. page load times for visitors from different continents. Based on the data collected from my cycling website – before and after migration.
1. Introduction
Because of the web-hosting service prices increase (due to the cPanel price hike), I wanted to consolidate my hosting servers. To do that, I had to check if the UK is a good hosting server location for the websites that get the most visits from the USA, or do I have to keep them on a USA-based server. In other words: do I have to keep paying for the USA based server, or is the UK based one OK?
On various websites and hosting-related forums, I’ve read different opinions on the hosting server’s geo-location’s impact on page loading speed for visitors from different countries and continents. Some say it’s very important, others say it’s practically irrelevant, while most are somewhere in between, like: “it doesn’t matter much, but it can have an impact, but it depends…” and so on.
I’ve decided to test this on one of my websites, which is live, real, and has enough visitors for the statistics to be meaningful.
However, not all websites are the same. That is why I’ll first explain what factors affect page loading speeds from various locations, and then I’ll go to my analytics results.
2. What affects website load speed?
There are several factors that affect website page loading time (speed). In practice, they are often interlaced, that is: one can affect the others. I’ll divide the most important factors into a couple of logical groups, and explain them briefly.
2.1. Website optimization
For those interested in the details, I wrote a series of articles on (WordPress) website optimization. Briefly, website optimization for higher speed boils down to the following:
- Eliminating all the needless redirections – ideally, every visit should see a maximum of one redirection, directly to the appropriate (sub)domain and protocol version. For this website that is:
httpS://IO.bikegremlin.com (using the capital letters for better clarity) - Using reliable and fast DNS servers – so when visitors’ browsers request to see “yoursite.com”, there’s as little as possible delay before receiving a reply on which IP address “yoursite.com” is. I’ve been very happy with Cloudflare’s DNS service (how to configure Cloudflare DNS).
- If using WordPress, or some other CMS, choose your themes and plugins wisely, and try to avoid having too many plugins – so your website can be stable and fast, without causing too much load on the hosting server.
For more details see the best WordPress themes, as well as how to choose high-quality plugins, and the fastest permalink structure. - Website image optimization – in terms of compression and re-sizing to fit the size that is actually displayed. Images that are needlessly large just slow the website down (and take more storage space on the server), without providing any benefits to the visitors.
- Minimization, compression, and combining several JavaScript and CSS files into fewer larger files – simply put: one larger file, especially if it is compressed, will be transferred a lot faster than many smaller files, especially if they aren’t compressed. This is explained in the 4th and 5th chapters of the caching and compression article.
Related to this article’s topic: if a website is poorly optimized, it could work very slowly, so the difference that server location makes is less critical. If a server takes 5 seconds to show a page, it makes less difference whether a visitor reaches the server in 1 second, or in 0.1 seconds.
Website optimization also includes caching and CDN implementation, but they are explained in separate chapters below, for better readability:
2.2. Website caching
In separate articles I explained what website caching is, and how to cache a WordPress website. I’ll explain caching briefly here, though I recommend you read at least the first two chapters in both of these articles.
After you made a mistake and, of all the Google search results, decided to click on the one labeled “Hosting server location impact on website speed,” Google directed your web-browser to the following URL address:
https://io.bikegremlin.com/19312/server-location-speed-impact/
After a technically rather complicated operation that I won’t be describing here, your browser got a reply from a DNS server telling it the IP address of the hosting server that serves the io.bikegremlin.com sub-domain – but this part is not important for the story about caching.
When the browser came to io.bikegremlin.com hosting server, it requested the page:
19312/server-location-speed-impact/
But! Server doesn’t have this page. Since I/O Gremlin is a WordPress website, server has to do the following:

Picture 1
Translating picture 1 to English:
- Browser requests this page:
19312/server-location-speed-impact/ - PHP running WordPress searches the MySQL database table “wp_posts”, for a post ID “19312”.
- MySQL database gives PHP all the info needed for creating this page: all this text, picture placement, locations of all the picture files on the hosting server etc.
- PHP generates the HTML code of this page, gives it to the server, so the server can serve it to your browser.
And voila, here’s the beautiful article you are now reading! 🙂
The server does this over and over again for every page, for every visitor. Even though most pages remain exactly the same for weeks, or months (until I update something).
Would it be wise to create all the pages once, save them on the server, and then serve the completed web-page files to every visitor?
It would be even better if we could update the pre-created pages only when I add, or remove some text, or pictures on them.
That is what caching boils down to.
Related to this article’s topic: websites with no caching, or poorly configured caching will work slower and put more load on the hosting server (which can result in further slowing down, in case of many website visits). Hosting server that is too slow diminishes the impact of visitors geo-distance from it – extra 0.5 seconds don’t really matter if the total page load time is already over 5 seconds.
2.3. CDN (Content Delivery Network)
CDN is a service that has several servers around the World (at least one on each continent). What are these servers used for?
- You can upload all the pictures, or videos shown on your website pages to a CDN service’s servers.
- CDN service then copies all those pictures and videos to all the servers in its network.
- Then, when a visitor from Australia visits your website, all the pictures can be served from a CDN server near by, even if your hosting server is in New York.
The basic idea is that text transfer takes very little bandwidth and can quickly be transported far away, while pictures and videos are a lot “heavier,” so it helps a lot when they are served “from the neighbourhood.”
Notable CDN services are Bunny CDN, and Cloudflare. Cloudflare offers a lot more than just CDN (for details see Clouflare explained).
Related to the topic of this article: by using WP Cloudflare Super Page Cache WordPress plugin, or paying 5 $ per month to Cloudflare, you could serve cached versions of your complete website pages from Cloudflare’s servers that are nearest to your website visitors – without the need for anything to be served directly from your hosting server.
So, depending on which CDN you use and how you implement it, your website’s hosting server location could become pretty irrelevant.
Of course, there’s no free lunch, so I suggest you read on.
2.4. Website type
Not all the websites are created equal.
This website serves information, and tutorials. You can read it, and comment if you like. That’s it.
When I edit an article, or when you leave a comment, the old cached page version gets invalidated, and a new cached version is created. Most visitors just run away read without posting any comments, so cached page versions last a long time, and the server is not heavily loaded.
Let’s compare this to an e-commerce website (a site where you buy stuff on-line).
- On an e-commerce website, each visitor will have different contents of their shopping cart (we don’t all buy the same products).
- Adding any new product to the cart requires showing the updated cart contents.
- Sold products need to be deducted from the stock count, so people don’t pay for a product that is out of stock.
Caching an e-commerce website is a lot more difficult to implement properly, and fewer pages can be cached.
Also, a website like an e-commerce shop will update the database more often, which puts more load on the server and slows the website down. Similar goes for websites with pages/content that are often updated.
There are ways to replicate the website database and keep the replicated copies synchronized, but the bottom line is: depending on the website type, cache and CDN implementation can be more limited, and hosting server location could become more important.
2.5. Hosting server speed
I mention this at the end because people often blame “bad hosting provider” for poor website performance. Instead of doing their homework and optimizing the website first.
It could even be argued that a fast, powerful hosting server could mask some website design and optimization problems because it will keep it running without any hiccups.
My logic is: it’s never too late to throw more money on a more powerful engine, but if we’re going too slowly, perhaps we should first check if we’ve disengaged the hand brake. With that in mind, these are my WordPress hosting recommendations.
2.6. Hosting server geo-location
This surely does have some impact. Connection speed is not the same when you are connecting to a server in the same country, and when you are connecting to a server on the opposite side of the globe. Depending on how well a website is optimized and whether it uses a CDN, the impact can be smaller, or greater, but it surely exists.
The world is getting better, and better inter-connected. High speed, high bandwidth optical cables are drawn over lands and along the ocean floors, connecting countries and continents – but the speed and the bandwidth are still not unlimited.
Another problem is the routing. If you are connecting from England to France, it makes no sense to go through Russia. Although there have been great advances in routing efficiency over the past 10 years, it is still not always perfect. Some countries and regions still have less than optimal routing patterns to some other countries, from time to time.
It can be said: the closer a hosting server is, the better. But how much does this really matter? Well, that is what this article and this experiment are all about – that’s what I’m trying to determine. 🙂
3. Is page load speed important?
If you ask SEO ninjas – speed is very important. Is this true? I would say: “it depends.”
More about SEO, and on-line branding – how to make a good website.
Technically neither Google nor SEO ninjas are lying when they say: “speed is one of the website ranking factors.” But let me use an analogy:
I’m not lying if I say that “height is one of the football player selection ranking factors.” But what does this tell you? Not much. If we disregard those shorter than 5 feet, and those taller than 7 feet, all the others are quite acceptable in terms of height – their running speed and ball controlling skills are a lot more important, crucial.
So this sentence is correct, but still misleading. Such a sentence would make more sense if it were used for basketball players, not football players.
What has this got to do with websites?
For websites, content quality is of crucial importance – i.e. what they are offering to their visitors.
For informative websites, as long as pages don’t load noticeably slowly (say over 5 seconds), load time is not that important. These are our “football players.”
For web-shops, especially those selling stuff people don’t really need, it is very important that everything goes quickly and smoothly. Not giving the visitors time to stop and think – since they might re-consider their potential purchase. With such websites, even a 3-second page load time can be too slow, and the conversion rate could drop noticeably. These are the “basketball players.”
Briefly: faster is better, but with diminishing returns as you go below 3 second page-load times.
4. Does website visitor location matter?
Internet connection quality and speed between New York City and Washington DC, may not be the same as the connection between New York and Northville (Michigan), even though the distance is similar. The same goes for connection quality between different countries and continents.
Here’s a link containing the underwater communication backbone cables map, connecting different countries and continents. Another link shows an older map, from 2018, that includes land communication backbone lines.
If a vast majority of your website visitors come from a certain country, or continent, it makes sense to look for a hosting server in that country, or at least another one that has a good connection to that country.
This leads us to the main topic of this article – the fun part. 🙂
5. Hosting server location impact on page-load speed
5.1. Test website type, DNS, CDN, caching, and visitor locations
For testing, I used the English version of my cycling website – bike.bikegremlin.com. It’s a real, live website, that gets over 1,000 visitors each day, so a good tool for realistic testing.
I first tested the website on a US East Coast based hosting server, then migrated it to a UK (London) based server.
Both servers are practically identically configured, by the same hosting provider (HostMantis – my review).
The website uses Cloudflare DNS, and the free Cloudflare CDN package – so some pictures, but not all, are served from Cloudflare’s CDN servers, while all the pages are served directly from the hosting server. Basically, I sacrificed a bit of website speed, in order to gain more knowledge and experience on this topic. 🙂
Such Cloudflare service configuration is simple, 100% free, and can work well even for e-commerce websites (though for those I would recommend paying 5 $ per month for caching all the “cacheable” content on Cloudflare Edge CDN servers – see Cloudflare APO for WordPress on their website).
Update September 2023:
My Cloudflare Pro and WordPress APO experience
For caching, I’m using a LiteSpeed server and WordPress plugin, with activated Redis object cache.
Thanks to this, most of the pages are served from the hosting server’s cache, resulting in faster response and reduced server load.
Another important information is that the test website uses Google AdSense ads. As I explained in the article on that topic, showing Google AdSense ads slows websites down, i.e. pages with ads take noticeably longer to completely load – while Google Analytics registers only visitors who don’t use an AdBlocker. These ads are loaded asynchronously, only after other, more important, page contents have already been loaded. Still, Google Analytics page load time stats include the time needed to download and present all the on-page ads. This is why Google Analytics test results, shown in chapter 5.4, show relatively long page load times (always longer than two seconds).
Another caveat is that sometimes, for some pages, for some visitors, advertisers don’t pay for showing any adverts. This introduces a random element that I can’t control. In order to reduce the effect of this “randomness,” I will take Google Analytics samples of at least 30 days. In the second test comparison, I’m taking 3-month averages, from the same months of the two consecutive years.
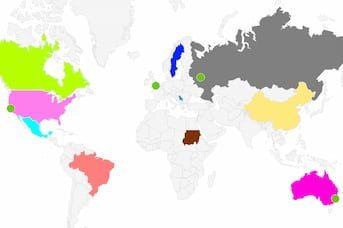
Visitor location structure is the following:
By countries:
- USA – just over 30 % of the total website visits.
- UK – just under 20 %.
- Philippines, Australia, and Canada – just over 5 % each.
- India, and Singapore – around 3 % each.
- Germany, Malaysia, and Netherlands – around 2 % each.
- Indonesia, Belgium, France, New Zealand, Finland, and Italy – around 1 % each.
All the other countries individually have under 0.5 % of the total number of visits each.
By regions (sub-continents):
- North America – just below 40 % of the total website visits.
- Northern Europe – just over 20 %.
- Southeast Asia – just over 12 %.
- Australasia – around 6 %.
- Western Europe – around 5 %.
- Southern Europe – around 4 %.
- Southern Asia, and Eastern Europe – each around 3 %.
- Eastern, and Western Asia – around 2 % each.
- South America – around 1 %.
The other regions are around, or below 0.5 % of the total website visits each.
5.2. Testing method
For testing, I used HetrixTools uptime monitor (affiliate link), and Google Analytics data (how to connect Google Analytics to a website).
I first set the website on a US East Coast based server, then migrated it to a UK (London) based server, on the 12th of February.
Using HetrixTools, I monitored uptime and page load response time from the following locations:
San Francisco (USA West Coast), London (UK), Moscow (Russia), and Sydney (Australia).
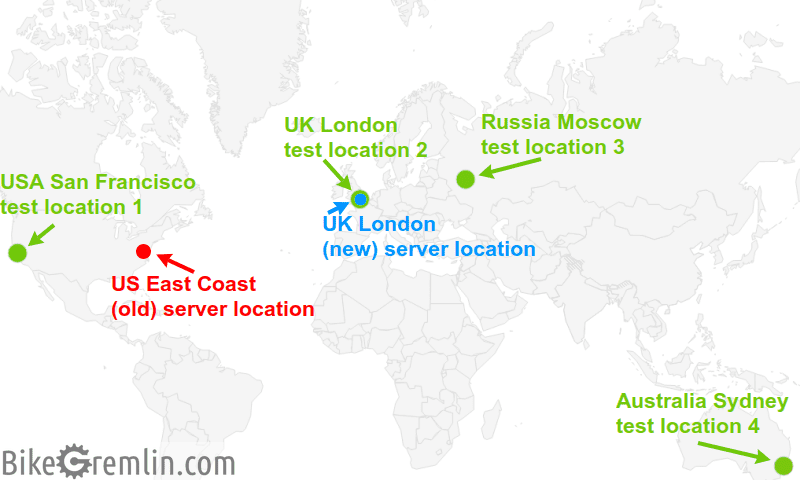
Picture 2
Google Analytics collected user performance data from all the locations, during the entire testing period.
5.3. Test results using HetrixTools
These are the HetrixTools test results:
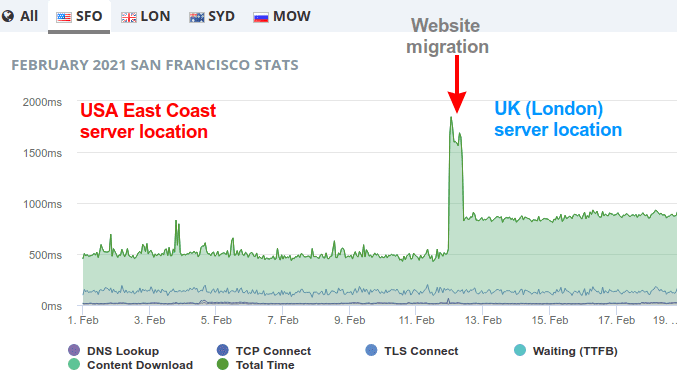
Picture 3
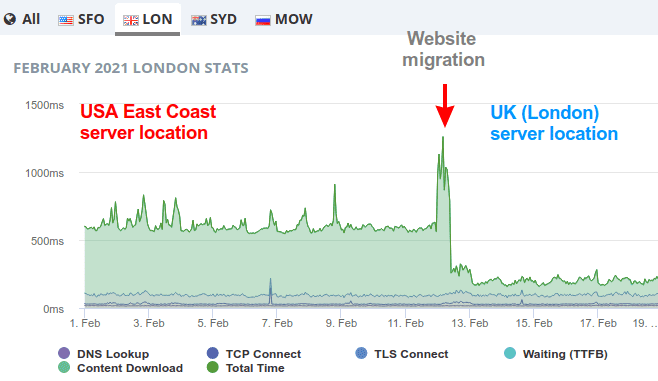
Picture 4
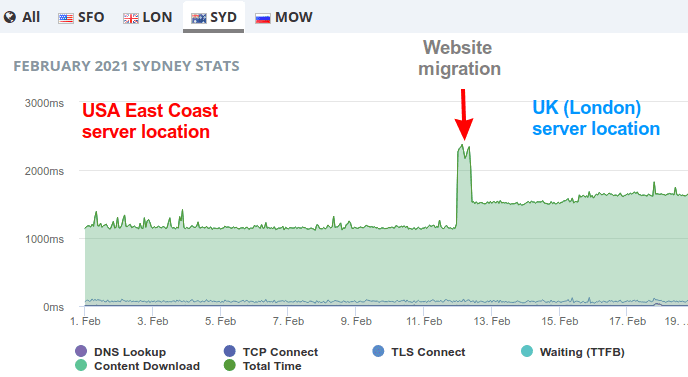
Picture 5
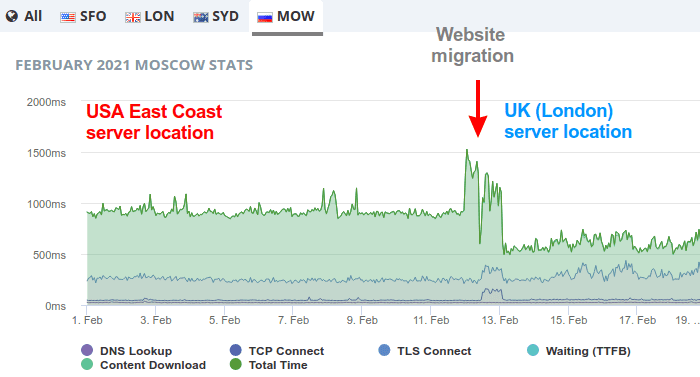
Picture 6
A brief sharp rise in page load times is noticeable around the 12th of February, due to website migration (due to emptying all the caches and temporarily putting the website off-line on two occasions – my mistake).
Average page load times according to HetrixTools, in milliseconds:
| Server locations -> / Test locations: | US East Coast hosting server location | UK London hosting server location |
| San Francisco (USA) | 500 ms | 860 ms |
| London (UK) | 580 ms | 130 ms |
| Sydney (Australia) | 1180 ms | 1520 ms |
| Moscow (Russia) | 920 ms | 560 ms |
Table 1
Note:
As far as I know, HetrixTools doesn’t get affected by Google Analytics, and it blocks Google AdSense adverts loading, so the measured times are a lot faster compared to what real, live visitors experience.
However, I think that the changes in the average website page load times caused by changing the hosting server geo-location are very well reflected in these test results.
Based on this, since most website visitors come from the USA, website migration to a UK based hosting server has prolonged the average page load times for most visitors.
But! We are talking tenths of a second here. And what about real-life, human visitors experience – not HetrixTools robots? Google Analytics can give us a more accurate answer to that question.
5.4. Test results using Google Analytics
At the start of February 2021, I had some Google Analytics problems. I noticed them and fixed them only after the website migration. So I have no data for the period of 10 days before the website migration to the London (UK) hosting server, and 6 days after that.
The website was migrated on the 12th of February. I’ll work with the data I’ve got: using January 2021 stats for the pre-migration results, and data after the 18th of February 2021, for the after-migration results.
This is what January 2021 stats report looks like, for the average page load time from all the locations (aggregated, then calculated average):
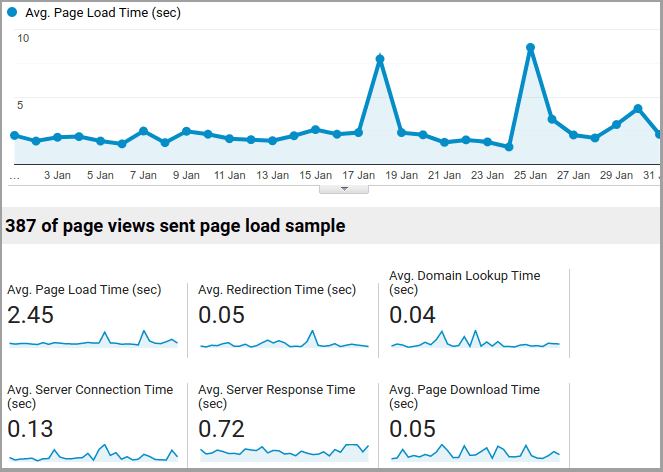
Picture 7
In order to save some space, and improve readability, I will provide all the data in the form of tables. The all locations average includes the countries with very few visitors, that aren’t listed in the table.
When picking the locations, I primarily ranked and chose them based on the number of visitors, but I included some (sub)continents, in order to provide a broader picture of how the hosting server location affects the page loading times for the visitors.
First test period/sample:
| Server locations -> / Test locations: | US East Coast hosting server location January 2021 | UK London hosting server location 18th February – 20th March 2021 |
| All locations – average | 2.45 seconds | 2.26 seconds |
| USA | 2,54 | 1.77 |
| UK | 2.53 | 3.09 |
| Australia | 2.72 | 2.81 |
| Europe | 2.19 | 2.28 |
| South America | 2.51 | 1.76 |
| Africa | 3.09 | 2.29 |
| Asia | 2.90 | 3.15 |
Table 2
The test site is a cycling one, so the number of visitors has some seasonal variations. To minimize the impact of these, I’ll make another stats comparison, with data from March, April, and May of 2020, for the US East Coast hosting server location – and data from the same months of 2021, for the UK (London) hosting server location. For now, I’ve got the data for 2020, and 2021 will be available in June.
Updated – June 2021.
Second test period/sample:
| Server locations -> / Test locations: | US East Coast hosting server location March, April, May 2020 | UK London hosting server location March, April, May 2021 |
| All locations – average | 2.90 seconds | 2.27 seconds |
| USA | 2.17 | 1.88 |
| UK | 2.09 | 1.60 |
| Australia | 3.73 | 2.84 |
| Europe | 2.30 | 1.78 |
| South America | 3.32 | 4 |
| Africa | 6.33 | 9.98 |
| Asia | 7.30 | 3.16 |
Table 3
6. Data analysis and comparison
In the conclusion I will first discuss the HetrixTools test results, then Google Analytics test results. I will update the test results and the conclusion in June 2021, when March, April, and May stats are gathered.
HetrixTools
There are two peculiarities to consider when discussing the HetrixTools speed test results:
- When testing page load times, HetrixTools blocks all the ads and analytics. In fact, only page source code is loaded, so not even images and CSS are loaded. Hence there are fewer “third party requests” when loading pages and given page load times are faster compared to what the “normal visitors” can experience.
- Servers that HetrixTools used for testing generally don’t change their addresses and have a good, stable Internet connection quality.
Because of this, HetrixTools gives “rather optimistic” page load times, but also accurately shows any changes in page load times, affected by the server’s connection speed and performance (when generating pages).
The relevant info here is the absolute change in page load times (in milliseconds). This is shown in table 4:
Longer page load times are shown with a preceding “+” sign, and shorter (faster) times with a “-“.
| Test location | Page load time change on UK vs USA hosting server location |
| San Francisco (USA) | + 360 ms |
| London (UK) | – 450 ms |
| Sydney (Australia) | + 340 ms |
| Moscow (Russia) | – 360 ms |
Table 4
It seems that for US-based visitors (where most people who visit the website come from), the average page load time has increased by 360 ms. Is this noticeable? Before drawing any conclusions, let’s discuss Google Analytics reports:
Google Analytics
This tool also has its own peculiarities:
- Google Analytics considers only those visitors who aren’t using any AdBlockers. So the times shown are with all the ads loaded. This reduces the number of test samples.
- Different visitors have a highly variable quality of Internet connection. This adds a lot of variabilities.
Because of this, I expect a larger sample (taken over a longer time period) will provide more precise results. My preliminary conclusion, after taking and comparing only two 31-day periods of collected data will be complemented once I gather more data, in June 2021.
Updated, June 2021
| Test location | Page load time change UK vs USA hosting server location |
| All locations – average | – 0.63 seconds |
| USA | – 0.29 |
| UK | – 0.49 |
| Australia | – 0.89 |
| Europe | – 0.52 |
| South America | + 0.68 |
| Africa | + 3.65 |
| Asia | – 4.14 |
Table 5
Table 5 shows that, after migrating the website from the USA to a UK based hosting server, average visitor page load times (“speed”) has improved for the USA based visitors, while it’s become slower (on average) for the visitors from the UK and Europe!?
7. Conclusion
Based on this, I conclude the following:
- There are a lot more important factors than the hosting server location, such as:
website optimization, hosting server performance, and visitors’ Internet connection quality. - I need more data in order to reduce the effect of randomness.
This is why I expect the 3-month period comparison, due in June of 2021, to be more conclusive.
Updated, June 2021
I saw a great difference in page speed load times for Africa (+3.65 seconds), and Asia (-4.14 seconds).
Other locations saw more moderate differences. From a moderate speed boost for the USA (-0.29 seconds), to a relatively big speed-up for Australia (-0.89 seconds).
The countries and continents with the largest number of visitors all saw an increase in the number of visitors, and a decrease in the average page load times: USA, UK, Europe, Asia, Australia – sorted by the number of visitors, in descending order.
On average, globally, I measured a 0.63 seconds shorter (faster) page load times.
For websites that are selling stuff people don’t really need, every split-second difference can affect the ratio of visits to purchases. But even for that use case, I would worry more about website optimization, and server performance, than about the hosting server location.
As far as BikeGremlin goes, I have only measured an increase in the number of visitors (and bounce-rate decrease) – both from the USA, Europe, and the other locations.
My subjective impression:
Working on websites, and uploading/downloading content and backups, works a bit faster for me with a UK based server, compared to the USA based one (I am in Serbia, Central Europe).
When I’m viewing the website as a visitor, and paying attention to the page load speeds, I can tell the difference, but I wouldn’t call the USA server page load times slow. It all loads nicely and quickly – though the UK based server makes that even faster.
Last updated:
Originally published: