This is a work in progress – I’m translating the original article from Serbocroatian when I find the time – chapter by chapter. It will be finished. New articles will follow.
Articles in this series, by “logical” order:
- [01] GPS, GSM, WiFi, Bluetooth, FM, Internet
- [02] Mobile phone GPS navigation – basics
- [03] OruxMaps installation and initial setup
The main purpose of this article is to enable the reader to use other people’s routes, as well as to create their own navigation routes and to be able to “explore the unknown” by themselves. With the final goal to help people gain more confidence when hiking, or cycling in forests, or mountains, explore new areas. Not necessarily relying solely on GPS and technology. A separate post explains the GPS and GSM technology basics in terms of smartphone navigation.
Any additions, or suggestions on how to make it clear, comprehensive, yet as simple to read/follow as possible are more than welcome. Text you are about to read is a result of over a decade of experience with hiking and using all sorts of GPS navigation gadgets. The authors have done their best to offer a “digested” version – easy to understand, so that you can do it all by yourself with minimum effort. This, first version, took days, but it will be improved further, mostly in terms of making it more simple.
1. Introduction
1.1. Basic idea
The basic idea of this manual is to, in as little steps as possible, set the base for planning a hike and its tracking on a mobile phone (smartphone). A base that can later be expanded in many different ways. It is written with the best intentions and I hope it will be helpful, but don’t blame the manual, or its author, or the place where you’ve found it in case you get lost in the woods.
For a start I hop you won’t get lost in the manual so at the beginning I gave a brief overview of the route that we’ll follow together (contents). Well go through this together and stop at several important and, I hope, interesting points. Through our hike, we’ll gather breadcrumbs of knowledge that will eventually, give a clear, full image.
If you are reading this on paper, feel free to underline things. That track will help you if you get back to this hike.
On our hike we’ll see a network of other paths that lead to broadening the knowledge, which we’ll only “touch” or cross roads with, but won’t be following this time, but we know they exist and can be explored.
1.2. Advice
This text turned out a bit longer than was planned and I’ll first like to give you one piece of advice for your and mine sake: don’t be afraid.
This advice is for you because everything you’ve really wanted to understand – you’ve managed, didn’t you?
But also for me, because it is an excuse that if you don’t make it to the end of this text, it’s not for my poor explaining, but because of you.
This manual will have two parts. First is theoretical and I hope it will give you the base for better understanding of everything that will later be demonstrated through a complete example. In the first part I tried to explain things in a way I would like to have had it explained to myself before I had figured it all out.
At the same time, I’ll try to make the example in the second part such that it can be done even without fully understanding the first part, for those that get discourage for any text longer than an average Tweet.
1.3. Beginning – what is our goal
I wish to take a hike through an area I’ve never been before. I’ve just got good will and a mobile phone.
- How to find and pick which route to take?
- Kow to translate that desire to a file I can transfer to a mobile phone?
- Which smartphone application should I use?
- I’d like to have, within the application, some map where I can see the terrain and my prepared route and, if possible, a network of routes that are at my disposal if I wish to make the hike a bit longer, or shorter than my initial plan.
- I’d like to, while I’m walking, see my current position, but also to see the track of where I’m coming from and be able to later record that and show it to the others.
2. Basic terms
2.1. Map
2.1.1. Vector and raster maps
Map will be the background that we’ll always have shown in our application and, depending on its quality (in terms of information) we’ll have more, or fewer details in it.
There are two types of maps: vector and raster.
Vector map is placed within a file inside which everything we need is written in a “mathematical” way. The size of that file is drastically smaller compared to a “raster set” that we would need to cover the same area – and I’ll explain why.
The word “mathematical” is used in a sense that when we zoom a part of the map, wanting to see a smaller area, but with more details, it contains all that’s needed to show this new level of details inside the one file where everything is written in a form of “mathematical formulas” in the map calculates what it will draw on our screen, while the image is always sharp.
Raster map is an image. It can really be a photo, like satellite photos of the earth, or it can be drawn. We’ll mostly use drawn maps on the terrain, but the process of zooming in and the reason why the term “raster set” was used above will be explained using satellite photographs.
Disregard physics for a while and imagine we are in a balloon that flies high above the Earth. Then imagine the Earth as a flat board. And we take a photograph of the entire, flat, Earth. Our photo will have as many pixels as the resolution of our mobile phone camera has. As long as we want to look at the earth as a whole, the picture will look nice.
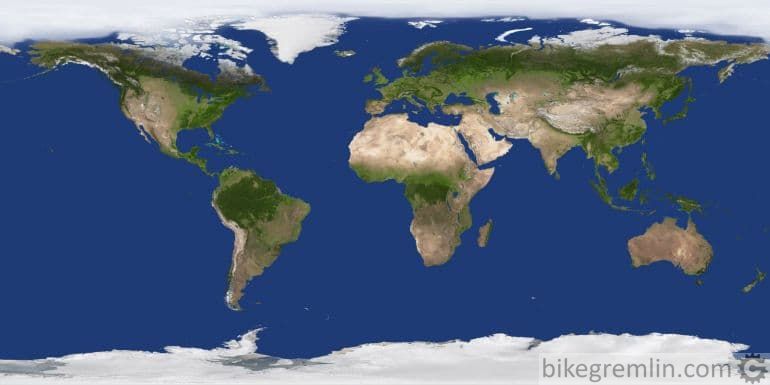
Picture 1
However, if we want to see one part a bit better, closer, say Europe, what we can do is make one part of the entire Earth photo enhanced so that only Europe fits the screen. This, of course, will make the image very blurry if we want to zoom in further, to show Serbia for example – and even worse if we just want to show Fruška Gora mountain (near Novi Sad).
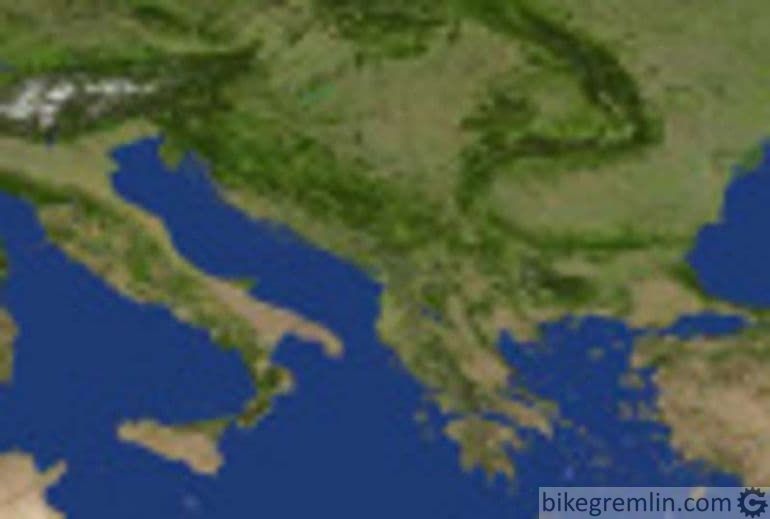
Picture 2
Other option would be to put the balloon a bit lower and take a photo of only Europe. We would have a picture with the same resolution as the first one (as the camera resolution dictates), but now it covers only Europe, so it’s nice and sharp when we are looking Europe only. Zooming in to see Serbia and Fruška Gora would make the picture a bit less horrible, but still blurry.
So, the smaller area we wish to see in detail, we must go down, lower and take a photo of the same resolution, but covering a smaller area.
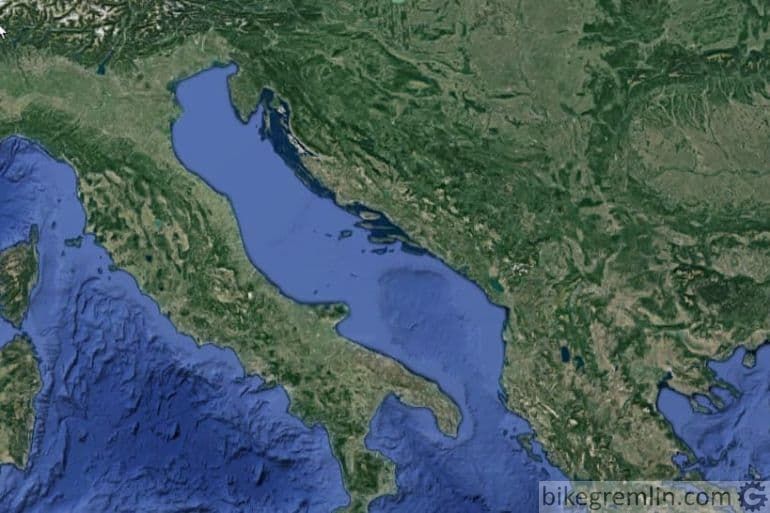
Picture 3
The task done by an application that shows us a map will not be to zoom in on the one, starting picture of the entire Earth, but to show us an image ideal for our desired level of zoom.
A small digression: what would be tempting, as an idea, would be to assemble all the images of Earth taken from the smallest height, into one huge image and then be able to zoom in as much as we like, but that image would be so large that, due to its size and the time needed for an application to process it, the image would be useless.
Let’s call the view of the entire Earth: Zoom 0. Zoom level that shows Europe and Asia will be Zoom 1.
So, for the entire Earth we need one photo. When we go to Zoom 1 level, the entire Earth will consist of 4 photos taken from a lower height (altitude).
When we go to Zoom 2, each of the 4 photos will be replaced with 4 new photos with more details. So, for Zoom 2 level we’ll have 16 images, while for Zoom 4 level we’ll have 256 photos in order to cover the entire surface of the Earth (at the desired level of Zoom).
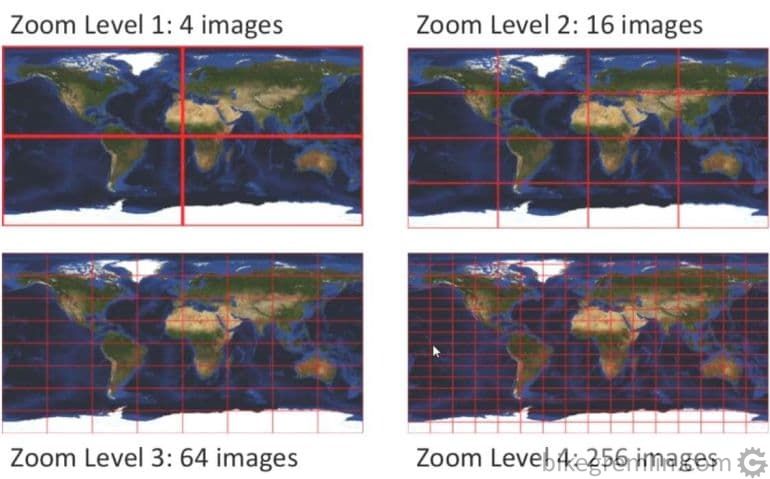
Picture 4
Maps usually have a maximum level of Zoom 18. For our needs level of Zoom 16 will be enough (minimum 15, maximum 17). What this means exactly will be explained in the chapter about Offline and Online maps.
And here’s one deliberately imprecise and oversimplified comparison:
Vector map of the entire Earth would take all the memory of a smartphone and its processor would be just fast enough to process it (zoom in and out).
In order to download all the layers of a raster image for the entire Earth (i.e. millions of smaller images from various areas on all the 18 Zoom levels), it would take 1000 times larger memory, but the processor could be 1000 times slower because, to remove one small image and replace it with another is not a difficult task (that is why we’ll always download only the map parts that are of interest).
If we had one raster image of the entire Earth, it would take half the space than having it divided per levels of zoom, but also 1000 times faster processor because it is very difficult to process such a large image (so that option is out of question).
Map that we’ll use in our example will be drawn, not satellite image (or balloon one), but the principle is the same.
2.1.2. Online and Offline maps
A vector map fits in a moderately sized file. It must be created (bought), one must have a device that understands that format (vector maps come in various formats) and install it on the appliance.
After that, the map remains there forever, without needing to go on-line to zoom in a part of the map.
If such a map is available for the region of interest it is definitely a good option. The only question is how good it is in terms of the needed information: tracks, places of interest…
An example of a vector map are all the Garmin devices, that can take a Garmin vector map. Once installed, the map stays on the device even when it is not connected to the Internet.
That same map could be installed on a mobile phone, if we had an application that could read it. Orux application that we’ll explain in this tutorial can read vector formats as well. In our example, we’ll use two vector maps one of which will be in Garmin format.
Vector maps are always welcome if available, but when they aren’t, we can always use free raster maps, which can be downloaded to our device.
If our device has an internet connection, it will all work fine, but let’s see how that works.
Say we start viewing the entire Earth. Application will download that one image of the Earth for Zoom 0. We zoom in Europe. Application downloads that one (of 4 images) image that shows Europe and Asia for Zoom 1 level. If what we want to see is in one of the 4 images on Zoom 1 level, application will download both, but it won’t download all 4 images for Zoom 1 level. And so on – Zoom 2 level has a total of 16 images and we’ll download only 1, or two that are of interest (the area being zoomed in). Not the other 14-15 images.
This way of working, when we are relying on the Internet connection is called Online.
In other words, application in Online mode downloads only the minimum data needed and it’s usually kept in the device’s cache, so the exact used images on various zoom levels could be seen later, even if the Internet connection gets broken. But all the images that we hadn’t viewed would not be available without an Internet connection.
Now, what if we know that where we are going there won’t be an Internet connection?
Most applications allow for maps to be prepared in advance for working in Offline mode. What would that mean?
It would mean that while we are connected to the Internet, we can mark an area, say 10 times 10 kilometers (of course, we will mark an area of interest to us) and download all the images for all the zoom levels so they are kept on our device and available offline.
Depending on the size of the chosen area and the desired zoom level, the space taken by the images varies. That is why we will only download images up to a zoom level 16 (or 15, or 17, depending on the size of the area of interest and the amount of available memory).
If we don’t download images for a certain level of zoom and then try to zoom in further, the application will use the last most quality (most “zoomed in”) image and start zooming it as an ordinary image – so the details will become larger, but more blurry.
In our example, we’ll download one map of the area of interest to work on in offline mode.
2.2. Track and Route, Waypoint (POI, Landmark, Placemark, Midpoint), gpx and kml(kmz) file formats, Overlay and Layer
2.2.1. About words (and how to further complicate in order to explain)
Many words and terms, I admit. At the same time, there are words that sound differently, but have a similar meaning. To make it more interesting, some terms can have more than one meaning. But before we start the adventure of making the sense of it all, let’s see why we would use those terms in the first place.
Imagine you are standing in front of a paper map with different coloured crayons in hands. The map is not new, so it already has some paths and tracks drawn on it and some places of interest, but you know for a fact that there is a lot of what is not visible on the map.
What would you wish to draw (or see drawn) on the map?
1) Marked some points of interest (benches, nice views, wells, caves…).
2) Lines.
- a) Track network as lines where others have went (which are certainly, or most probably paths, or at least we know it’s passable).
- b) Marked line of a planned route for our walk.
- c) Line of a track that marks where we have passed on a day until now.
3) Marked areas (like minefields, or an estate).
4) A picture in a free form (like the arrangement of armies in the battle of Kursk, or a smiley, or someone’s phone number).
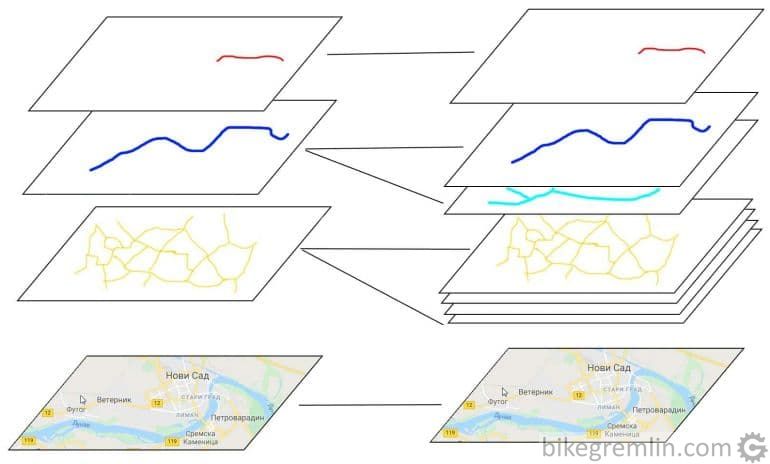
OK while we’re imagining, imagine one more thing. We’ll need it for later. Imagine that, instead of drawing directly on the map, we draw on a see-through foil that is placed on top of the map. In fact, imagine exactly three transparent foils over the map. Later we’ll agree on what is drown on which foil. Also, we’ll see later that two foils closest to the map can be split in some additional sub-layers.
Picture 5
Now that we know why, I’ll try to explain the essence and how the imaginary, but palpable idea of drawing on maps has been transfered to the digital world of computers and smartphones.
For that purpose, since there’s already a lot of confusing terms, we’ll introduce some of our own terms that don’t exist anywhere (just keep them on this page, so we don’t get laughed at).
The base of everything is a Dot.
A Dot has its coordinates that determine its position. That is its main attribute.
In order to translate our above listed 4 wishes for drawing into computer language, we’ll introduce three new terms, that are ours alone, for three different types of Points:
Da bismo mogli nekako one 4 želje za crtanjem po karti da prevedemo u rečnik računara uvešćemo tri nova naša i samo naša pojma za tri naše vrste tačaka:
- Interesting Point
- Breadcrumb point
- Mathematical point
1. Interesting Point
Letter P in the “interesting Point” is written in capital because it is a Point. A place of interest we want to mark, like a bench, cave etc.
Apart from its basic attribute (that it is defined with its coordinates), Interesting Point can also have a name, description, icon that represents it on the map (in Orux application this can also be a photo, or even an audio recording).
2. Breadcrumb point
Letter “p” in Breadcrumb point is lowercase, because there are many of them and one does not mean much. Only grouped together they make some sense.
Let us imagine a fairytale image. We are in an unknown forest and want to make sure that we’ll be able to return to our starting position. The only thing that we can think of is to start leaving breadcrumbs (or small rocks) to mark the trail we have passed.
Each breadcrumb is a point with its coordinates. Together, they create a trail that we have taken, i.e. one jagged Line. This looks like 2c item from our list of wishes.
If we see a Line made of breadcrumbs that create a Route we wish to follow on this day – this looks like our wish item 2b.
Let the item 2a be a track network made up of breadcrumbs left by others.
Just two small notes:
Firstly – yes, you are free to imagine rocks in stead of breadcrumbs (or, if you think that senses synergy helps memorize things better and if you wish, you could imagine something else). But imagine trails on the ground that connect breadcrumbs in three different colours – say red for the track we make, blue for the route we wish to follow and yellow for the track network left by the others (they will not necessarily be of that colour on the screen, but we’ll use it for this example).
Secondly – I know that some of the words are bold. That is because I’m hoping you’ll read this text at least two times, so next time you come to this place it should be clear why they are bold, i.e. that I’ve been trying from the text’s start to use them consistently with the explanation that follows.
I know that in our wish list some of the words were underlined, but that was just to confirm that we hadn’t missed any: Point, Line, Area, Picture.
I hope that we have explained the Point and the Line, while explanation of Area and Picture will take some magic and mathematics.
3. Mathematical point
Letter “p” in Mathematical point is lowercase and we won’t spend much time with it, but let it, within this tutorial, do its magic to solve drawing those Areas (called Polygons) and in a way be involved with showing other Pictures that we might wish on our foils.
Just a small demystification: say we wish to mark a triangle shaped area. It is defined by three points. Those are our Mathematical points (with their coordinates) that, with Instructions that come with them, where it is written that we don’t care for joining them with lines like Breadcrumb points, but that we are interested in the area they mark.
Now we have listed all our points and seen that everything we want can be made just using them as building material (OK, let’s say we also might need some pictures). Plus Instructions on how to interpret the points. Instructions – Italic. I know. That is because that word too is important, for now, until we find a better one.
One part of the basics has been established, but before we introduce some other term from the heading of this chapter, a small ground preparation:
Using Points and Instructions how to interpret them we can do it all. Fine, say you believe me.
Let’s take an Example:
We were walking and our phone i.e. our application has provided us with two things: option to save coordinates of points for our track and instructions how to store them for future interpretation in that particular way.
We have 100 Breadcrumb points with their 100 coordinates that are connected to create a track of that day and 5 Interesting points with their 5 coordinates that we had marked during our walk.
Points and instructions together compose our information about the walk – Information.
But there are two questions.
First is about the instructions.
Points are points – they have their coordinates and that’s it. But is there a unique way of giving the instructions, or could manufacturers of different devices have their own ways of writing that Information down. In the remainder of this text I’ll call those instructions Format. So, the question is:
Are there different formats? …You know the answer… Yes, of course – why would something be simple and uniform whan it can be complicated and variegated. But don’t worry – well take the bare minimum we need from it all.
Other question, partially related to the first one, is where can the Information be physically written.
One obvious place that we’ll be using a lot is a File.
Our Information will be written (and we’ll find and use others’ Information) in a file that has .gpx extension, or kml(kmz) – those are simple text files and we’ll explain them a little later, but here we’ll just make an agreement that when I write we are using a gpx database, it means that instead of it we could use kml(kmz) as well. Once we get to the point why we need a kml(kmz) file, we will explain another small difference (here I’ll just explain that kmz is the same as kml, only zipped).
So we’ll be finding gpx files all around the Internet, downloading them to a computer, or a smartphone, uploading it, even make some of our own in this manual, using free online tools.
Now, I wish to stress something else. Some applications, like Orux, have their own internal storage where they write Information using their Format. Orux calls this their internal Database. So Information is stored in it, we can see it, use it, but it is not visible as a gpx file. If the Information was created using the application and we wish to have a gpx file to share with others, we must create an export of the Information from the Database to a gpx file.If, however, we need information from some external gpx file, we can import it into Orux’s Database. Don’t worry – it’s not as complicated as it sounds.
In short: Information is what matters (small spoiler – there will be two kinds of it: tracks and waypoints). In Orux it is written inside the Database (format does not concern us), while with the rest of the world it is communicated using gpx file format.
Although I have mentioned complexity of various words and terms, the good news is that we basically only need a few of the key words. I’ll be using and explaining them in the context of the Orux application, i.e. what the terms mean in Orux.
2.2.2. Track
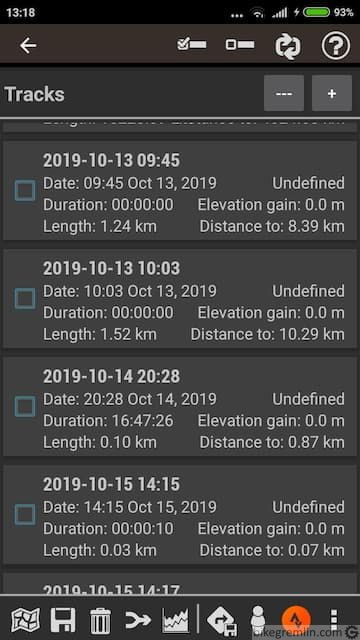
Remember the breadcrumbs? A track would really be a track – a trail that someone passed, recorded breadcrumb by breadcrumb, i.e. point by point on some device (that has a GPS receiver and an application that can do that) and put that Information into a gpx file, or in Orux’s internal Database. That information is called a Track in Orux, it has its name, which is automatically (unless we alter it) comprised of time when the recording was started.
A View on the track list in our Orux database looks like this unless we named each track which would be logical and easier to understant:
Picture 6
Don’t worry – in the other part of this manual there will be more detailed images and ways to get to various screens. For now we’re still explaining what and why, we’ll explain later how.
In Orux’s database there are only two types of Information: one are track-s, the other are Waypoints (more on them later as well).
Let’s say that the Information (about our track) has been exported to a gpx file. Unlike afore mentioned files, either with raster, or vector maps, in which we would not be able to see anything, a gpx file is somewhat human “readable”. If we open it in any text editor, we can see that it contains GPS coordinates of all the points recorded by a device. Visually, application that shows us the track can just connect the points with a line and show them as one entity.
For those who like to see with their own eyes, if you promise to disregard the top part for now (that contains all the Waypoints – we still haven’t talked about them). You should be able to easily spot our Breadcrumb points, tightly packed one next to the other, presented by their coordinates.
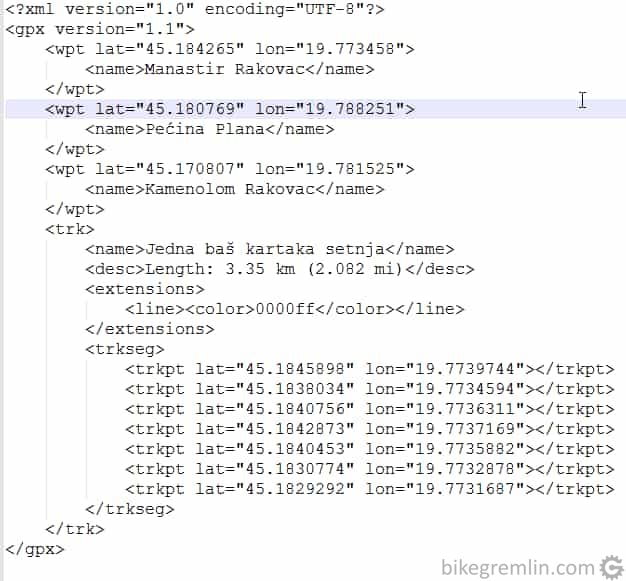
Picture 7
Once we go on a walk and start recording a track, Orux draws a thin red line behind us, connecting the breadcrumbs from our starting point to the one we are at currently.
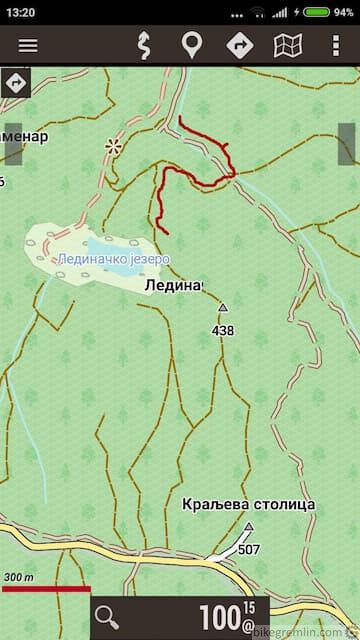
Picture 8
The shortest track would contain only two points – starting and ending, connected with a straight line. The more points there are in a track between the two obligatory points, the closer it is to the real route that has been walked.
How often you record points on a device, hence making the track less jagged, can be set up on the device. Also, when editing a gpx file (which we will be doing), there is an opportunity (and danger) to have the editing program reduce an entire track to just say 500 points, no matter how many points there were in the original. The reason being that some devices only allow a track to have a maximum of 500 points.
OK, someone took a walk, had a device, recorded their track, exported it to a gpx file and put it somewhere we can take a look at it. The questions where, how and why and the answers will come a bit later, but before that let’s answer a question: “can a track be created without walking and carrying a device?”
After all, track is just an array of points written by their coordinates in a certain way.
Yes, the answer to this question is affirmative. If we were to just try and decypher a gpx file and if we knew the exact coordinates of each point, we could use any text editor and do it “manually” – which we will do. Still, if we had a bit of help, with some application, to show us some map and enable us to draw on it, then record that to a gpx file, that would be much easier. Which we will do later.
Where were we? In fact, let’s get a bit more back in time, when we are still preparing for our walk. While preparing, using a computer, we will look at what others have walked and offered as their Final tracks in gpx files.
If we find a track we like, we could take it as it is and treat it as our Preparation track. Whatever the original file name was, for this example we’ll rename it to walk001_preparation_track.gpx.
If we don’t find any track that we entirely like, based on the information we have before starting, we could generate our own track. That is what we’ll doo, also naming the result as walk001_preparation_track.gpx.
However we come to the starting gpx, it is still on our computer.
The next step is to transfer that track to a phone and read it, i.e. import it to an Orux’s database.
2.2.3. Route
We want our track to guide us, to make it a route we will follow. That track is proclaimed a route, i.e. Track becomes Route. When loading we have a screen with two questions that Orux asks to help us start simply with what Orux thinks is the most logical if we are just about to proclaim a track for a Route. The questions are about two independent things: do we want to follow that route and do we want to start recording a new track.
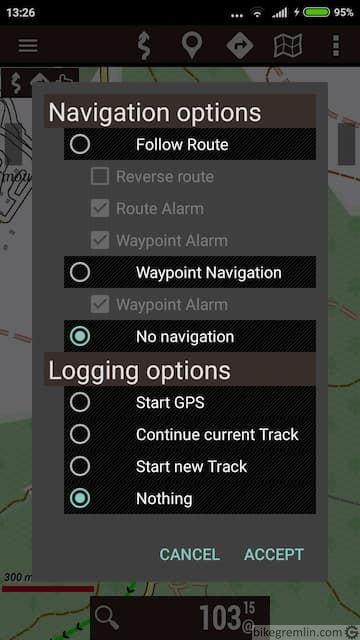
Picture 9
If we reply we want to record a new track, Orux will start recording our breadcrumbs and show a red line along our trail.
Regardless of whether we chose to follow a route, or just see it (if we don’t choose to follow it), it will appear as a thick blue, or green line, consisted of arrows pointing direction.
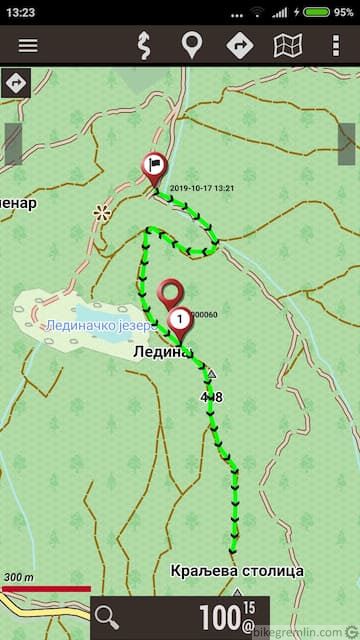
Picture 10
If we choose to follow it, Orux will notify us if we depart from it (unless we turn off these notifications).
We are walking. Following our route only visually, or getting notifications if we wander off it. Simultaneously recording our own track.
When we stop recording we have a new track in Orux’s base represented with the time of its start.
If we wish, we can export that track to a gpx file, naming it walk001_passed_track.gpx.
That Passed track can later be altered – we could remove some parts and share it with others. That will be our final track saved as: walk001_final_track.gpx, that can be shared and become someone’s Preparation track.
OK, that would be a lifetime of our walk through three gpx files with some time spent inside Orux’s database, but let’s get back to the walk itself and what we see on the device screen while we are walking.
We see two lines. A thin red line and a thick arrowed blue (or green) one. And a map.
Remember the crayons and foils over a map?
We said there are three. Now we’re talking about the top two (the one closest to the map is still empty).
The top one is where the Track is drawn. I won’t say Active track because – there can be only one – that foil can only have one track. We have started a new track and are drawing it from the beginning, but we could have loaded one from a day before (from Orux’s base) and continued walking where we had stopped. Either way, the top foil can have only one track.
A small digression that, like all digressions, introduces a bit of confusion, but also some facts that we’ll soon find useful. Anyway, if we continue a track from the day before, there are two options:
First is to literally continue – which means connecting the last point from the day before and our current starting point, which can cause a visually confusing long straight line, depending on how close today’s starting point is to the previous day’s ending point.
Other option is to, within the same track, create a new segment, which means it will have some autonomy (its own stats), but it is still within the same track with an existing segment.
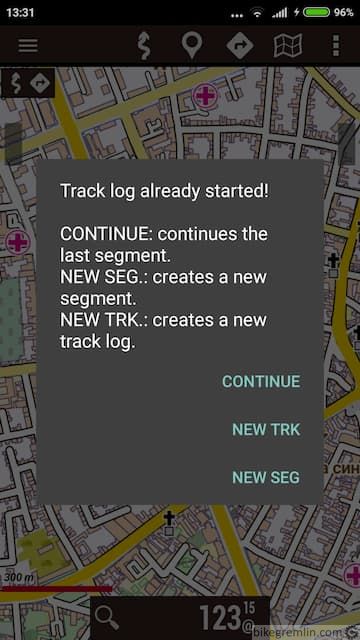
Picture 11
Either way, new or continued, we only have one track on the top foil.
The foil beneath it has routes. That foil can take several track that we wish to proclaim as routes. Only one of them can be Active i.e. only one can be blue (green), the others are less visible. Application can only warn us when we wander off the Active Route.
If we don’t manually choose an Active route, the one that was last imported will be the Active Route.
Here well touch up our picture of map and foils. The second one from the top could be pictured as two thinner foils making one whole. Top of the two containing Active Route drawn as blue (green) line, while the bottom one having all the other routes in a less visible colour.
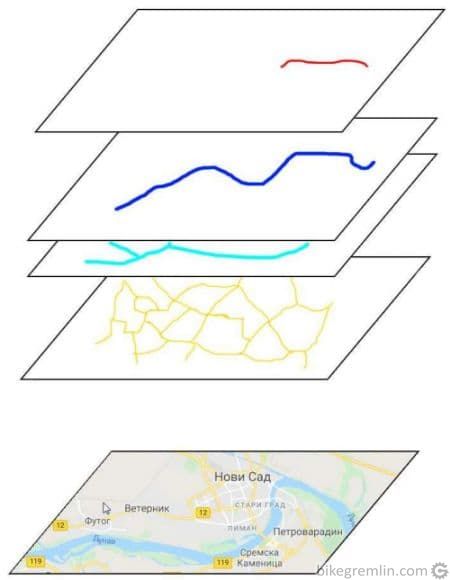
Picture 12
For all of you still reading this, if you feel like contemplating how to use all the info given so far to your advantage, there are two considerations you could use while we’re here:
First
If the foil meant for Route can contain several tracks, that might be a way to add all the tracks we find for that area, so we have a network of tracks.
Second
If one track can have several segments, perhaps we could add all the tracks into one, call it walk001_all_discovered_tracks.gpx, then have just that one on the foil for routes, next to that one walk001_preparation_track.gpx that we’ll proclaim to be Active Route.
My thinking is about like this:
Either is possible, most probably, but I’ll recommend something third: I’ll use the second consideration about makine a collection of all the tracks within one file (it won’t be a gpx, but will be a kml(kmz) file), but I’ll recommend we don’t put it on the second foil where it doesn’t belong logically, but on a third one from the top, the one closest to the map.
2.2.4. Overlay and Layer
To summarize:
Track is a series of points written by their coordinates, that makes a union. Gpx file is a file where all that is written using certain rules that we’ll call a gpx format.
Someone could say that one gpx file can contain several tracks. In this manual I’ll say that each gpx file is one track, that can have several segments.
When such a file is loaded in a device (either as track we wish to continue, or a route we wish to follow) it will visually display it all as a union – track in red, route in blue (green) line.
Our Preparation track that will be created on the computer before we start as well as Passed and Final track will consist of only one segment. We’ll use the option to have several segments within one track i.e. file in a different way, which is to form something we’ll call “Virtual path network”.
Virtual path network? Here’s an explanation, first we’ll see why, then what and how.
I wish to go somewhere I’ve never been. OK, I’ll find a map and it will show me what it has drawn. But maps that are available are still not rich enough with details as we’d like them to be, so many tracks are not drawn on them. The idea is to supplement that lack of information by supposing that others who walked that area and left their Final tracks have used paths where I too could pass.
If I could put several of them in one file and show it on a device in a layer above the map, I’d get a network that represents a Virtual path network (probably either real paths, or at least a passable terrain). This allowes me to plan a walk in a Preparation track and then alter it depending on the conditions at the site and the weather.
Remember? We still have that one foil closest to the map? We’ll transfer this network to that foil.
And one small addition to the picture with foils over a map. Imagine the foil closest to the map to be comprised of a random number of thinner foils stacked one over the other so that, apart from our Virtual path network, we could add other elements on other foils: points, lines, areas, images (like tanks, smileys…). Not all those elements can be put in a gpx file, but they can fit a kml(kmz) file.
We will fill just one of the thin foils with a track where we included, as segments, all the Final tracks that were of interest.
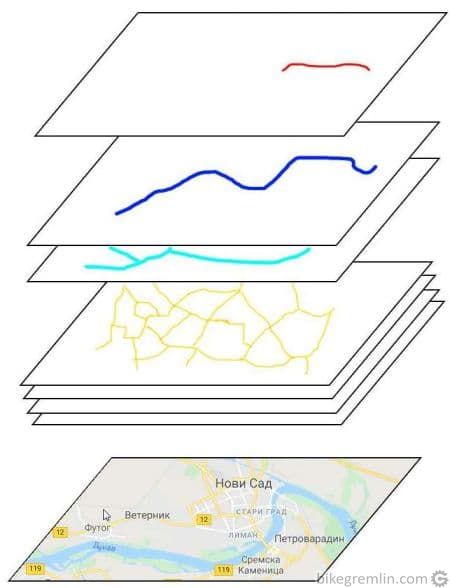
Picture 13
So we’ll have the three foils filled with one track each:
- first one from the top – will be a track (we record Breadcrumb points in and it follows our movement).
- second one – track loaded as route (Active Route).
- third one, closest to the map – track with many segments, creating our Virtual path network.
In Orux application, the third foil closest to the map is called:
KML Overlay
and thin foils it is comprised of are called:
Layers
The plan is now clear: several others’ Preparation tracks from gpx files will be imported into one database. How it is done we’ll see later, here’s just another explanation of where we will put it, i.e. what kind of database.
We said that gpx files can contain several track by creating one file with one track that has several segments. Because Orux prefers to have that third foil filled from files where the information is in another format, our track that has several segments (Virtual path network) will also be put in a text file that has the same function as gpx file, only with a slightly different format – format called kml, or kmz (kmz is zipped kml and it is used in exactly the same way). We also mentioned that kml(kmz) format is a bit richer and allows us to add pictures and other elements. That is the format promoted by Google for their maps.
To put it shortly: we’ll download some others’ final tracks (say someones_walk152_final_track.gpx, someones_walk279_final_track.gpx), put them in one file walk001_virtual_path_network.kml and learn how to load that file in a KML Overlay directly above the map displayed.

